The Graphical Service Review (GSR) provides the service adviser a visual tool that displays the recommended service intervals for your customers’ vehicles. Your service adviser can use the GSR to help educate customers on the importance of following the recommended service intervals to help keep vehicles in top operating condition and help comply with manufacturer warranties.
The GSR consists of a service review graph, service review form, benefits view, detailed recommendation view, and history view. It is pre-loaded with services that manufacturers recommend. You can also add your own services, called user-defined services.
To view the GSR on the screen, double-click on the green LubeSoft G icon located on your desktop (see below). The service review graph and/or form can also be printed directly from LubeSoft during invoicing.
![]()
For information about changing your service review setups, see the article Setting Up the Service Review.
You can print the service review from the Vehicle Selection screen, the LubeSoft invoicing screen, or the LubeSoft greeter screen. Whether you print the graph, form, or both depends on what you select in the service review setups.
From the Vehicle Selection screen:
| Note: | Print Form and/or Print Graph must be checked in the Service Review setups for anything to print from here. |
Printing the form only from LubeSoft G:
Printing the graph only from LubeSoft G:

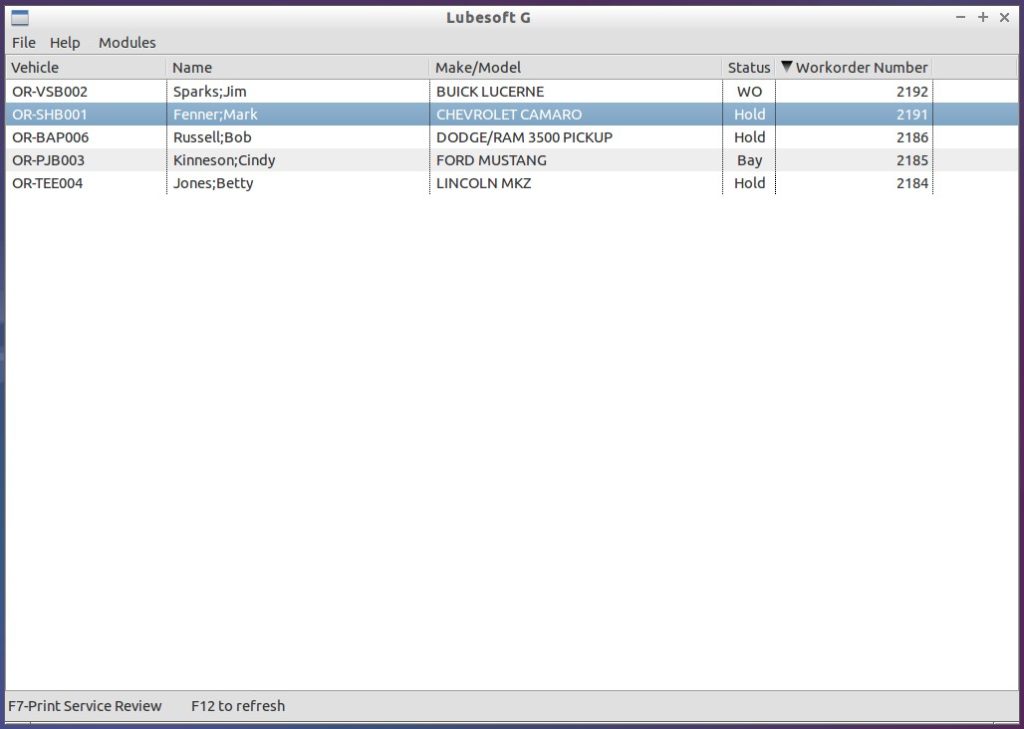
The main GSR screen is the vehicle selection screen. For any vehicles in your shop that have mileage entered, it displays the work order numbers, customer names, vehicle IDs, vehicle makes and models, and status of each work order.
Vehicles appear on the vehicle selection screen after the mileage has been entered for the work order in LubeSoft. If a vehicle is not displayed but the mileage has been entered, press [F12] to refresh the screen. Double-click on a vehicle, or highlight it and press [Enter], to view the service review graph on the screen. To print a service review, highlight the desired vehicle and press [F7]. To close the application, click the X in the upper-right corner, or press [Ctrl]+[x].
Once you have selected a vehicle, you are taken to a detailed Graphical Service Review screen. It contains separate windows for the Graph, Benefit View, Recommendation View, and History View.
Use the mouse to switch between tabs or the keys listed in the lower right corner of the screen. View details for the different services by clicking on them with the mouse or selecting them with the arrow keys. Click the printer icon in the header of the Graph window to print the service review graph to the default printer.
To return to the Vehicle Selection screen, press [F9].
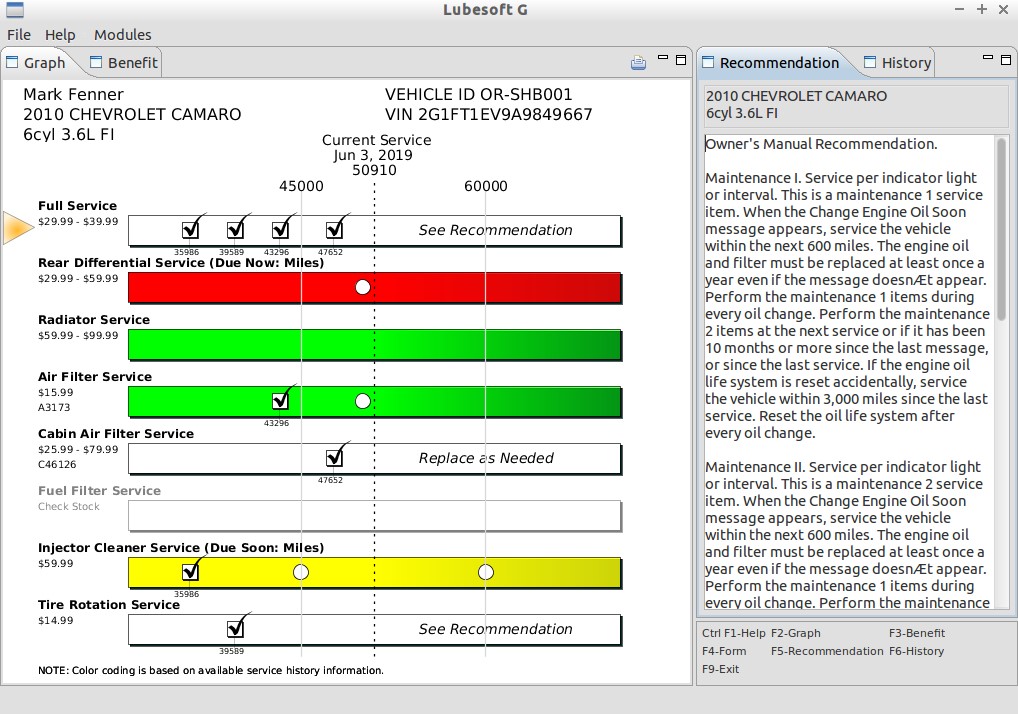
The service review graph is a one-page report that displays up to eight color-coded bars representing the recommendation level of each service on the graph. The graph also displays the service description, the vehicle service history, and the upcoming recommended service intervals. Services that your store has performed are marked with a check box; unperformed, recommended services are indicated with an empty circle. If you share vehicle histories between stores, then services performed at any of the stores that share history will appear in the vehicle history.
To access the service review graph screen, press [Enter] or double-click on a vehicle in the GSR Vehicle Selection screen. Use the cursory keys, or click a service with the mouse, to highlight a specific line for a service. You can print the service review graph for customers that may want to take a copy with them. The list below defines the different colors and provides examples that match up with the graph screenshot below.
| Note: | Color printing capability is available with an optional color laser printer. |
| Note: | Recommendations are based on recorded vehicle history in LubeSoft. Customers may have had services performed at other shops. |
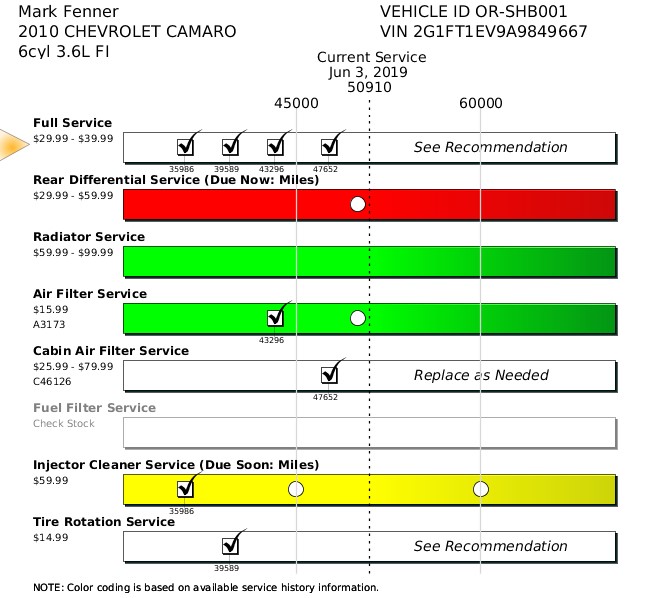
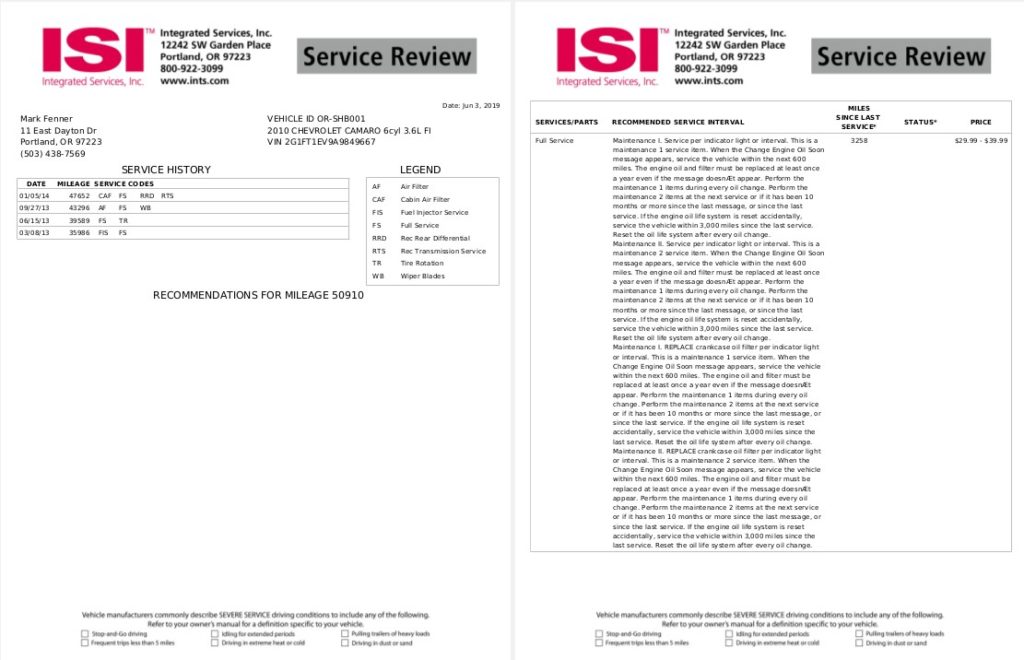
The service review form is a multi-page report that includes the customer and vehicle information, the vehicle history, and detailed recommended service intervals for the services you select on the Services setup screen. The service review form can be set up to include as many services as you want to display. Use it along with the service review graph to educate customers about services to keep their vehicles in top shape and help maintain their vehicle warranties. Below is a two-page example of the service review form.
To view the service review form, press [F4] from the Graph screen. This will open a PDF of the form.
The service review benefits view displays diagrams, animations, performance tips, and other information about the services and how the services benefit their vehicles. The service review comes pre-loaded with videos you can use. If you want to create your own custom pages, contact ISI Sales at (800) 922-3099.
To access the service review Benefits screen, click on the Benefits tab from the Graph screen, or press [F3].
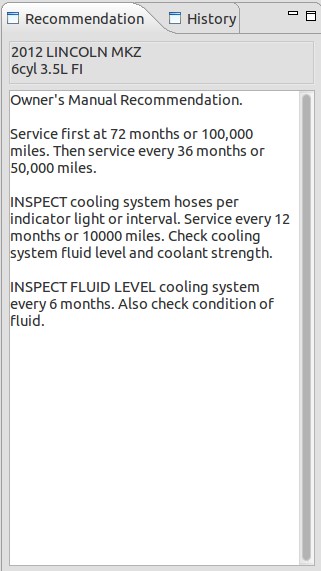
The service review recommendation view provides a detailed description of the recommended service intervals for the service currently selected on the graph. Along with the major services that manufacturers recommend, manufacturers will often recommend other services be performed on a regular basis to keep the warranty valid and keep the vehicle in peak condition. For example, a manufacturer may recommend a coolant system flush and fill every 50,000 miles. In between flushes the manufacturer may recommend tasks such as inspecting and topping off the coolant every 10,000 miles.
The Recommendation View is displayed next to the graph. Switch between viewing the Recommendation or History by clicking on the corresponding tab, or press [F5] for the Recommendation View.
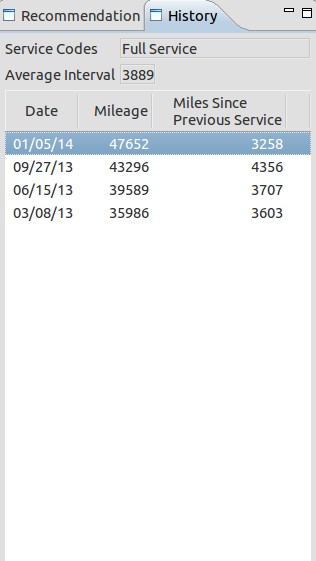
The service review history view provides a detailed history for the selected service. It also includes the date, mileage, and number of miles between visits when the service was performed. At the top of the history view is the average number of miles between visits. The average does not include the number of miles between the current visit and the most recent service as part of the average calculation.
For example, in the screenshot below the average interval is 3,889 miles.
(3603 + 3707 + 4356) ÷ 3 = 3888.67
To switch to the History View, click on the History tab or press [F6].
