
The ZIP/Postal Code Analysis Report provides a list of customer vehicle counts by ZIP (or FSA for Canadian postal codes), within a specified date range by analyzing all the invoices used in the date range you specify. The information on this report lets you know if a promotion brought customers in from a particular demographic area. This information can help you target certain ZIP/postal codes for a future promotion.
Additionally, the report shows repeat business, fleet counts, and coupon/discount use by ZIP/postal code. This information allows you to see how your business is divided geographically between fleet customers and regular customers. It also helps you analyze the use of coupons and discounts by customers in different ZIP/postal codes. For this report, the Repeat Customer figures indicate how many customers came more than once within the date range of the report. For the actual number of customers who came to your store, you can use the Vehicles count. The grand totals at the bottom show total numbers, average percentages and dollar amounts for the entire report.
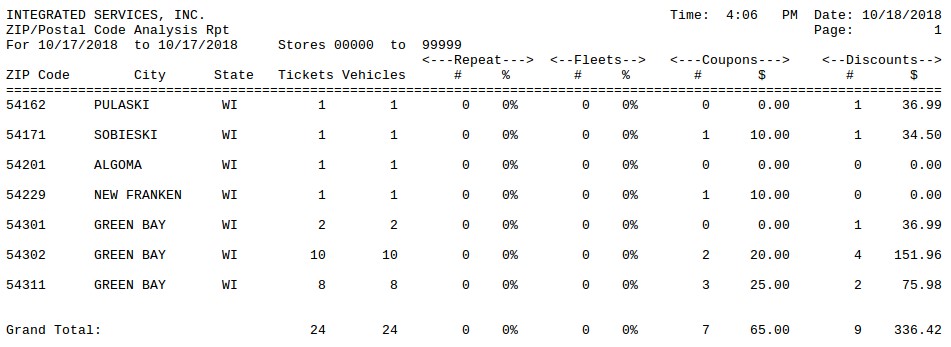
For each ZIP/postal code included on at least one invoice, the report prints the following:
Use the following steps to print a ZIP/Postal Code Analysis Report:
 |
This report can take up to several hours to run because it searches your entire customer database. |
| Field | Definition | ||
|---|---|---|---|
| Range of Dates | Fill in the beginning and ending dates for the range you want to include on your report. Leave blank to print the report for all information on your system. | ||
| ZIP/Postal Code | To select only one ZIP/postal code range, type it in both the Low and High fields. For all ZIP/postal code areas, leave this field blank. | ||
| Stores | Fill in the beginning and ending store numbers for the range you want to include on your report. Leave blank to print the report for service history from all the stores with which you share vehicles. If you only want to see the report for your store, type your store number in both the Low and High fields.
|
||
| Print Time on Report | Printing the time helps you identify the most current report when the same report is printed more than once during a day. This field defaults to Y to print the time on the report. If you do not want the time to print on a report, type N. We recommend that you always print the time on a report. | ||
| Duplex | This field appears for terminals that have report type 2 enabled in the Set Up Printer Controls screen. Duplex mode enables printing on both sides of the paper.
|
||
| Landscape | This field appears for terminals that have report type 2 enabled in the Set Up Printer Controls screen. It prints horizontally on the paper. | ||
| Number of Printed Lines per Page | This value tells the computer how many lines to print on each page of the report. A typical 11-inch page can contain up to 66 lines, but this field defaults to 60 to allow three-line margins at the top and bottom of the page.
|
||
| Total Number of Lines per Page | This field indicates the length of the paper in the printer. A typical 11-inch page contains 66 lines. Your system interprets a 0 or 66 in this field to mean that standard 11-inch paper is loaded in the printer. Because a 66 causes a form feed to take more time, accepting the default, 0, is recommended. | ||
| Print Report To | This field tells the computer where to send the report. The following list contains the different selections available for this field.
|
||
| Command Line Options | The line at the bottom of the screen contains commands to print the report and to save or change the report settings.
|
| Item | Description | ||
|---|---|---|---|
| Date Range | Range of dates for the report information. | ||
| Stores | Range of store numbers included in report. | ||
| ZIP Code | ZIP or postal code of one or more customers who had vehicles serviced during the date range.
|
||
| City | City corresponding to the ZIP or postal code. | ||
| State | 2-character state or province code corresponding to the ZIP or postal code.
|
||
| Tickets | Total number of invoices for the ZIP/postal code. | ||
| Vehicles | Total number of vehicles for the ZIP/postal code. One vehicle may have more than one ticket for the date range, so this number may be lower than the number in the Tickets column. | ||
| Repeat | Number and percentage of customers from the ZIP/postal code that came more than once in the date range. | ||
| Fleets | Number and percentage of customers from the ZIP/postal code that were fleet customers. | ||
| Coupons | Number of tickets that included coupons, and the total dollar amount of the coupons used. | ||
| Discounts | Number of tickets that included discounts, and the total dollar amount of all discounts. | ||
| Grand Total | Totals from all ZIP/postal codes included in the report. (In the Repeat Percentage and Fleet Percentage columns, the average percentage is reported). |
This report can be a useful tool for marketing. It is generally run on an as-needed basis. To monitor changes in the customer base, it is best to print the report regularly (monthly or quarterly, for example). The ZIP/Postal Code Analysis Report can help with your marketing efforts because it shows the geographic distribution of your customers. For instance, it indicates where repeat business is strong and where fleet customers are concentrated. This information can be used to help identify target areas for expansion and marketing. When you receive this report, watch for high or low activity and how well coupons and discounts are used in specific ZIP/postal codes.
You may want to monitor this report to get an idea of how well a particular marketing strategy works. For example, you may direct a promotional flyer to an affluent neighborhood or an industrial area with lots of potential fleet customers. An increase in business in a particular ZIP/postal code, along with a high number of coupons used, would indicate your promotion has been successful in that area.
The following items may affect the statistics on this report:
