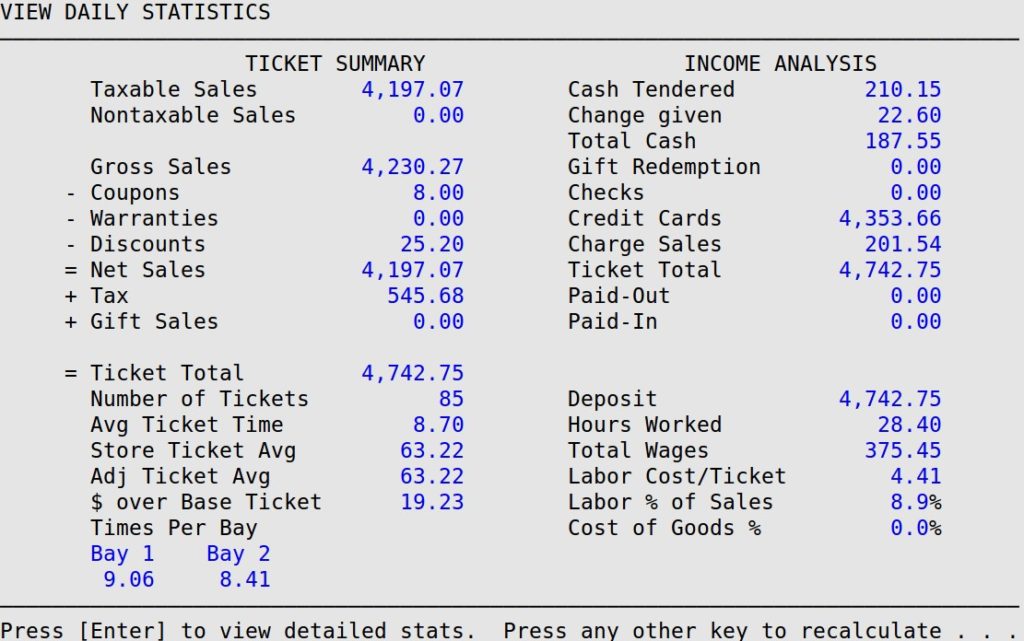
The View Daily Statistics screen is an on-screen report that calculates productivity for the store on the fly. It allows you to pause just long enough to assess the day’s sales, income and employee productivity. The first of three screens is similar in content to the summary Transaction Report, including a ticket summary and income analysis. In the Ticket Summary section, you receive up-to-the-minute sales figures such as the gross and net sales for the day. You can see the total number of tickets, as well as the average time and sales amount per ticket. The average time per ticket for each bay is also included to help you evaluate the work of each bay team.
In the Income Analysis section, the day’s receipts are broken down by payment type. You can see how much you have received in cash, checks and credit card receipts. Paid-in and paid-out amounts are shown, as well as the deposit. This information gives you an idea of how much money is currently in the till. Labor information on this screen includes the labor hours worked and total wages for the day. It also reports labor costs in two ways:
A quick glance at these figures tells you whether your labor costs are running too high for the day.
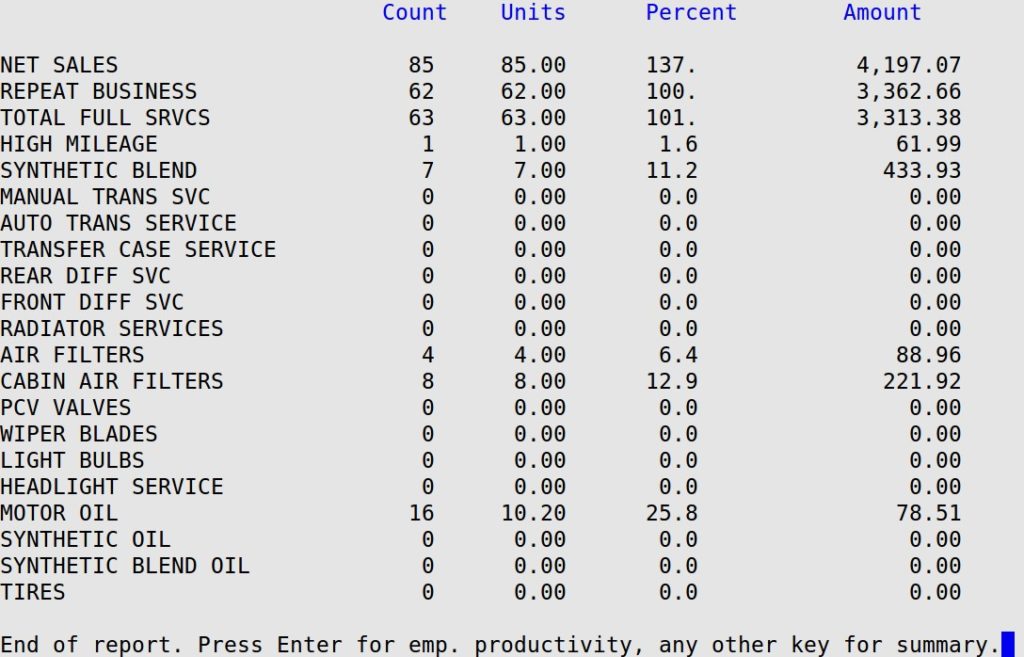
The second screen of the report is an on-screen version of the Quick Statistics Report that shows the following for each statistics item:
| Note: | As with the Quick Statistics Report, figures are rounded to the second decimal place during calculations. This makes the reported numbers slightly less accurate than the full calculations on the Statistics Report. |
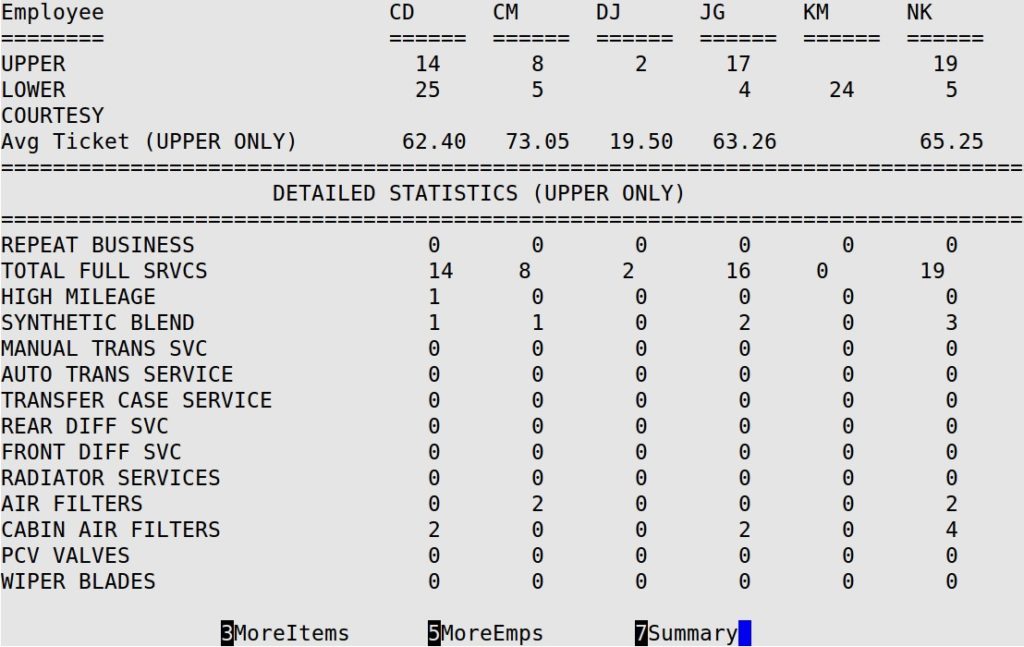
The third screen available through this option is the Employee Productivity screen. It is similar in content to the Employee Productivity Report. It has a column for each employee with productivity for the day, including the following:
Use the following steps to view daily statistics:
| Note: | Press [Spacebar] to update this screen with up-to-the-minute statistics. |
| Note: | You can specify in Set Up Statistics Sequences (1-3-4-4) which sequence numbers print on this page of the report. Type Y in the Print on Special Stats Report field for the sequence numbers that you would like to see during the day. |
| Note: | To have a specific service print on the Employee Productivity screen (1-5-2-2), enter a Y in both the Print on Employee Productivity? and Print on Special Stats Report? fields for that statistics sequence number in Set Up Statistics Sequences (1-3-4-4). |

| Section | Item | Description | |
|---|---|---|---|
| Ticket Summary | Taxable Sales | Taxable revenue. | |
| Nontaxable Sales | Nontaxable revenue. | ||
| Ticket Summary | Gross Sales | Total sales for the day before taxes, coupons, discounts or warranties. | |
| Coupons | Total amount of coupons used. | ||
| Warranties | Total amount for parts and services provided to honor warranties. | ||
| Discounts | Total amount of discounts. | ||
| Net Sales | Net sales amount.
Net Sales = Gross – Coupons – Warranties – Discounts |
||
| Tax | Total of taxes added to sales. | ||
| Gift Sales | Shows the dollar amount of gift sales if a gift certificate/card was sold on the invoice. | ||
| Ticket Summary | Ticket Total | Total amount of all the day’s completed sales transactions.
Ticket Total = Net Sales + Tax + Gift Sales |
|
| Number of Tickets | Total number of completed sales transactions for the day. | ||
| Avg Ticket Time | Average time per ticket. This does not include tickets over 30 minutes.
Avg Ticket Time = (Total Time for All Tickets under 30 Min.) ÷ (Number of Tickets under 30 Min.) |
||
| Store Ticket Average | Average sales amount per ticket for store tickets. This is either gross or net sales, depending on how the Gross/Net field is set up on screen 1 of the Center Control File (1-6-1-1).
Store Ticket Average = (Total Gross or Net Store Ticket Sales) ÷ Store Ticket Count
|
||
| $ over Base Ticket | Dollars above the base ticket average. | ||
| Adjusted Ticket Average | Store ticket sales amount minus the retail price of any items that are set up with excluded categories and were sold on store tickets. Depending on the store setups, it may be the same amount as the Store Ticket Average.
Adjusted Ticket Avg = (Store Ticket Average – price of items from excluded categories) ÷ Adjusted Ticket Count |
||
| Times per Bay | Average time per ticket for each individual bay. | ||
| Income Analysis | Cash Tendered | Total cash received for all sales transactions. | |
| Change Given | Change returned to customers in sales transactions. | ||
| Total Cash | Net cash received.
Cash = Cash Tendered – Change |
||
| Gift Redemption | Gift certificates/cards. Total dollar amount of gift certificates/cards redeemed. | ||
| Checks | Total paid for sales in the form of a check. | ||
| Credit Cards | Total paid for sales by credit card. | ||
| Charge Sales | Total charges for fleet customers. | ||
| Ticket Total | Total amount for all sales transactions.
Ticket Total = Cash + Checks + Credit Cards + Charge Sales + Gift Redemptions |
||
| Paid-Out | Total of paid-out transactions for the day. | ||
| Paid-In | Total of paid-in transactions for the day. | ||
| Income Analysis | Deposit | Total in your till from sales.
Deposit = Net Sales + Tax |
|
| Hours Worked | Total man hours for all employees clocked in plus those employees set up to include hours in labor calculations (such as managers who do not clock in). | ||
| Total Wages | Total wages of all employees (salary and hourly). | ||
| Labor Cost/Ticket | Labor cost per vehicle serviced.
Labor Cost /Ticket = (Total Wages +Total Commissions) ÷ Number of Tickets |
||
| Labor % of Sales | Labor cost as a percentage of the day’s net sales.
Labor as % of Sales = (Total Wages +Total Commissions) ÷ Net Sales) * 100 |
||
| Cost of Goods % | Costs of goods as a percentage of the day’s net/gross sales.
Cost of goods / Net Sales or Gross Sales = Cost of Goods % |

| Section | Item | Description |
|---|---|---|
| Quick Statistics | Count | Number of tickets that included the item or service. |
| Units | Quantity sold of the item or service. (This may be different from the Count above if more than one of the item are sold on a ticket.) | |
| Percent | Percent of tickets that included the item. | |
| Amount | Total received from sales of the item or service. |

| Section | Item | Description |
|---|---|---|
| Employee Productivity | Employee | Initials of the employee whose productivity statistics are reported below. |
| Upper | Number of vehicles for which the employee worked in the upper bay position. This is the position set up as position 1 on screen 3 of the Center Control File (1-6-1-1). | |
| Lower | Number of vehicles for which the employee worked in the lower bay position. This is the position set up as position 2 on screen 3 of the Center Control File (1-6-1-1). | |
| Courtesy | Number of vehicles for which the employee worked in the courtesy position. This is the position set up as position 3 on screen 3 of the Center Control File (1-6-1-1). | |
| Avg Ticket (UPPER ONLY) | Average net sales for vehicles the employee serviced in the upper bay position. | |
| Detailed Statistics (UPPER ONLY) | Counts of specific items and services that appeared on tickets the employee worked on in the upper bay position. For example, on this report, employee MDH worked eight full services in the upper bay. The report does not show statistics for the other positions |
This on-screen report can be used whenever you want a quick check of the day’s sales and labor statistics. It makes daily management decisions easier by providing hard data. For example, if your labor percentage is too high, you could send an employee home early. If the ticket average is too low, you could encourage your technicians to push add-on sales. As mentioned, View Daily Statistics is similar in content to the summary Transaction Report, the Statistics Report, and the Employee Productivity Report. Being familiar with these reports will help you interpret the day’s productivity. You can leave this report on screen as long as you like. Press [Spacebar] whenever you want to recalculate the data and make the report current.