The Usage-Based Reorder Report uses past data to determine what items need to be reordered. The system calculates how many of an item were sold per day during the date range. It then uses this number along with the information you enter to recommend reorder quantities. The report prints a list for each vendor, with items organized by category. Items that have enough coverage are not listed. It does not set order points. You need 90 days of inventory history for the report to be accurate. Information for each item includes the following:
The reorder quantity is calculated by finding the average daily usage over the date range you specify. This average usage is multiplied by the number of days until you reorder again plus the coverage you specify. This gives the overall quantity needed. From the overall quantity, the quantity on hand is subtracted to give you the quantity to reorder.
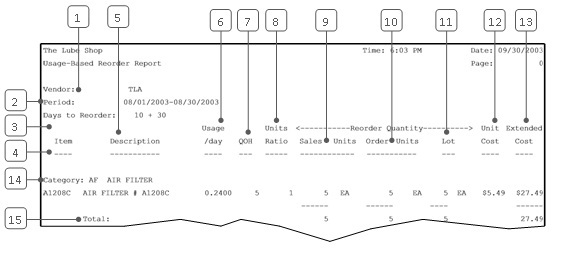
For example, on the sample report the Usage/day (average daily usage) of the first item is determined to be .2400 from sales history in August and September. This number is multiplied by the Days to Reorder (10 + 30 = 40) to get the quantity needed.
.2400 * 40 = 9.6
The QOH (quantity on hand) is subtracted from the quantity needed to get the quantity to order.
9.6 – 5 = 4.6
It is not possible to order 4.6 of the item. The Reorder Quantity/Sales Units is the amount you actually need, rounded up to complete units. For this item, the recommended number of sales units to order is five.
Often you must order more than the exact amount, especially when items come by the case or lot. The Reorder Quantity/Order Units is the smallest order you can place to have enough to last. For the first item on the sample report, it is possible to order just five. For the second item on the sample report, the Reorder Quantity/Sales Units is five, but the smallest possible order is one case, which contains 48 sales units. To find the number of sales units you are going to receive, multiply the Reorder Quantity/Order Units by the Lot.
Use the following steps to print a Usage-Based Reorder Report:
| Field | Definition | ||
|---|---|---|---|
| Print Time on Report | Printing the time helps you identify the most current report when the same report is printed more than once during a day. This field defaults to Y to print the time on the report. If you do not want the time to print on a report, type N. We recommend that you always print the time on a report. | ||
| Duplex | This field appears for terminals that have report type 2 enabled in the Set Up Printer Controls screen. Duplex mode enables printing on both sides of the paper.
|
||
| Landscape | This field appears for terminals that have report type 2 enabled in the Set Up Printer Controls screen. It prints horizontally on the paper. | ||
| Number of Printed Lines per Page | This value tells the computer how many lines to print on each page of the report. A typical 11-inch page can contain up to 66 lines, but this field defaults to 60 to allow three-line margins at the top and bottom of the page.
|
||
| Total Number of Lines per Page | This field indicates the length of the paper in the printer. A typical 11-inch page contains 66 lines. Your system interprets a 0 or 66 in this field to mean that standard 11-inch paper is loaded in the printer. Because a 66 causes a form feed to take more time, accepting the default, 0, is recommended. | ||
| Print Report To | This field tells the computer where to send the report. The following list contains the different selections available for this field.
|
||
| Command Line Options | The line at the bottom of the screen contains commands to print the report and to save or change the report settings.
|

| Field | Definition | ||
|---|---|---|---|
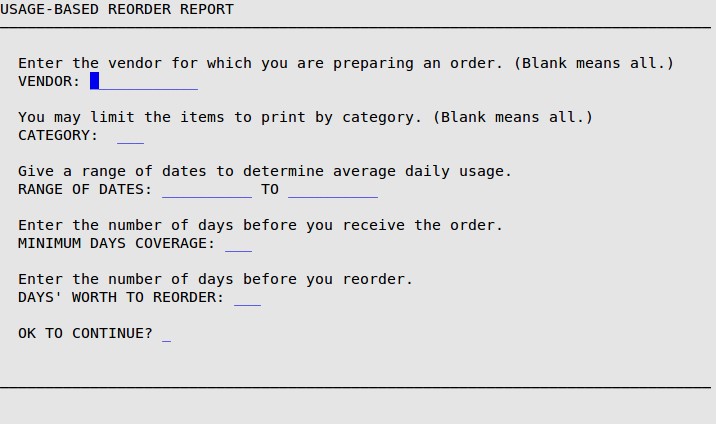
| Vendor | Type the name of one vendor to limit your report to a certain vendor. Leave blank for all vendors. | ||
| Category | Type the category that you want to be reported on your report. Leave blank for all categories. | ||
| Range of Dates | Type the range of dates that are used to determine an average daily usage. For accurate results on this report, it is important to use at least two months of data.
|
||
| Minimum Days Coverage | Type the minimum number of days required to receive the product from the vendor from the time an order is requested (from today’s date). | ||
| Days’ Worth to Reorder | Type the number of days’ coverage of this inventory item or category that you want to reorder. This is the number of days between your ordering cycles. For example, if you order once a month, you would type 30 or 31. |

| Callout | Item | Description |
|---|---|---|
| 1 | Vendor | Vendor name. |
| 2 | Period | Date range used to calculate reorder information. |
| 3 | Days to Reorder | This is the number of days’ coverage you need. It includes the minimum coverage you enter and the number of days until you place another order. For example, this report shows 10 + 30. Here, 10 is the minimum coverage and 30 is the number of days until you place an order, as entered before printing the report. |
| 4 | Item | Identification number of the inventory item. |
| 5 | Description | Description of the item. |
| 6 | Usage/day | Average amount sold daily, based on sales history. |
| 7 | QOH | Quantity on hand of the item. |
| 8 | Units Ratio | Number of sales units per purchase unit. |
| 9 | Reorder Quantity/ Sales Units | Minimum number of sales units you need to order to last until you place your next order. |
| 10 | Reorder Quantity/ Order Units | Recommended number of purchase units to order. |
| 11 | Reorder Quantity/ Lot | Number of sales units in the recommended order. This may be larger than the Reorder Quantity.
Reorder Quantity/Lot = Reorder Quantity/Order Units * Units Ratio |
| 12 | Unit Cost | Cost per sales unit. |
| 13 | Extended Cost | Total reorder cost for the item.Extended Cost = Unit Cost * Reorder Quantity/Lot |
| 14 | Category | Category of the items. |
| 15 | Total | Total of the extended costs for the category. |
This report helps you to keep inventory levels low so that less money is tied up in merchandise sitting on the shelves. This is especially useful for stores that manage inventory on a “just-in-time” basis. To keep on top of inventory needs, it is best to run this report on a regular basis, once a day or once a week. For accurate results, you should create this report using at least two months of data.
Sometimes the recommended quantity to reorder is above the minimum you need to last until the next purchase date. For example, this can happen if items come in a case and you need less than a full case. You should always order the quantity in the Order Units column to ensure that you have enough to last until you order again. In addition, seasonal usage can be evaluated by running the report for the season in the previous year. This may show you increased usage of a part during a certain season. For example, if you run a report for June to August of last year, you can check for an increase in sales of air filters during the summer months. You can do this for all history stored in your system.
The Reorder Notices Report, which is similar to this report, can be set up to run automatically as part of the closing process. For that report, however, you must determine the reorder level and the reorder quantity yourself. The Usage-Based Reorder Report can be used to determine typical usage and reorder needs. These numbers, if consistent, could be entered as the reorder levels for the Reorder Notices Report.