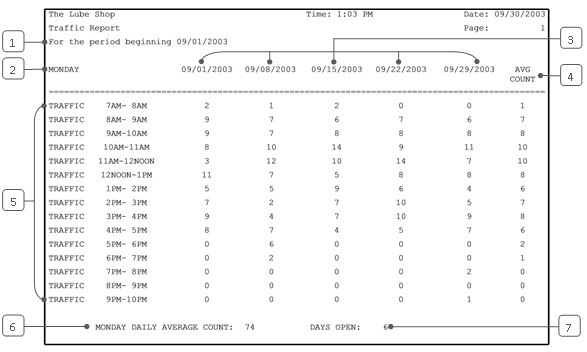
The Traffic Report calculates typical hourly traffic for a given workday, for either the last four weeks for a selected day (for example, the last four Mondays) or every day for 29 days prior to the beginning date. When run as a closing report, the information goes back 22 days. The report includes the following:
The report also shows how many of the reported days the store was open. If the store was closed one of the days, the traffic is zero for that day. The average is based on the number of days the store was actually open.
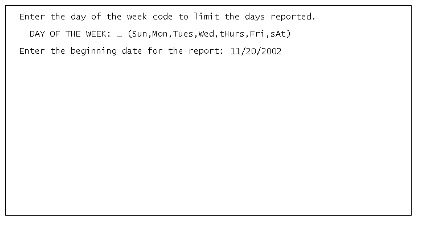
Use the following steps to set up and request a Traffic Report:
| Note: | The information on this report comes from the traffic categories set up in statistics. Any changes to those categories affect the information on this report. |
| Field | Definition | ||
|---|---|---|---|
| Print Time on Report | Printing the time helps you identify the most current report when the same report is printed more than once during a day. This field defaults to Y to print the time on the report. If you do not want the time to print on a report, type N. We recommend that you always print the time on a report. | ||
| Duplex | This field appears for terminals that have report type 2 enabled in the Set Up Printer Controls screen. Duplex mode enables printing on both sides of the paper.
|
||
| Number of Printed Lines per Page | This value tells the computer how many lines to print on each page of the report. A typical 11-inch page can contain up to 66 lines, but this field defaults to 60 to allow three-line margins at the top and bottom of the page.
|
||
| Total Number of Lines per Page | This field indicates the length of the paper in the printer. A typical 11-inch page contains 66 lines. Your system interprets a 0 or 66 in this field to mean that standard 11-inch paper is loaded in the printer. Because a 66 causes a form feed to take more time, accepting the default, 0, is recommended. | ||
| Print Report To | This field tells the computer where to send the report. The following list contains the different selections available for this field.
|
||
| Command Line Options | The line at the bottom of the screen contains commands to print the report and to save or change the report settings.
|

Codes:
| Note: | If the date you select is less than four weeks ago, the report prints fewer than four dates of data. |
You can also set up this report on the Setting Up Closing Processes screen to print automatically during closing processes.

| Callout | Item | Description |
|---|---|---|
| 1 | Date | The beginning date for the four-week period covered in the report. |
| 2 | Day | Day of the week for the report. |
| 3 | Dates | Dates of reported traffic information. |
| 4 | Avg Count | Average hourly count. These are averages of the counts reported for the days the store was open. |
| 5 | Traffic by Hour | Hourly time periods for which vehicle counts are shown. |
| 6 | Daily Average Count | The average of the total daily counts for the days the store was open. (Total counts for the individual days are not shown.) |
| 7 | Days Open | Of the days on the report, the number when the store was open. |
You can use this report to get an idea of what business is typically like on a specific day of the week. You can also tell whether the count varies or is consistent from week to week. You should run this report after your store has been open long enough to gather at least four weeks of data. Look at the individual days as well as the averages. If one day looks unusually busy or slow, it may cause the average to be inaccurate. You can look at more than one four-week period if you suspect a particular day or month was unusual.
This report can help you increase productivity by tailoring your employee hours to your business needs. Based on the average traffic flow for a particular day, you can predict when you will need lots of help and when you will need fewer employees. You can then determine your employee schedule based on this information. You can also use this report to identify slack hours. You might want to develop a promotional offer to bring business in during slack periods. By monitoring this report, you can tell whether your promotion has been successful. For specifics about the revenue during each time period, refer to the Statistics Report or the Comparative Statistics Report.