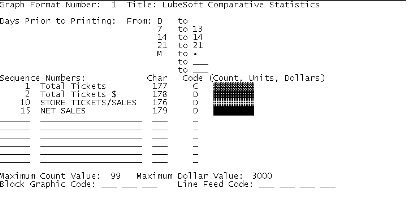
These instructions require you to know the type of printer you use. Most LubeSoft customers use an Okidata printer running IBM emulation. In this case, do not follow the Okidata instructions, but follow the IBM printer instructions. To decide which printer emulation you have, look at the back of the printer. If there is a sticker containing the words IBM Compatible Graphics Printer, follow the IBM printer instructions. For a sample report, see the Bar Graph article.
Use the following steps to set up a new bar graph format or edit an existing one:
Enter date for printing
This field defaults to the current date (MM/DD/YYYY).
Enter format number
Type the number of the bar graph format you want to add or edit. Assign a new number to set up a new format.
OK to continue?
Type S to set up the format.

Graph Format Number
The system displays a unique 2-digit number you assign to each graph format. (Display only)
Title
Fill in a 40-character line to describe the report.
Days Prior to Printing:
Day(s) of the different time periods you want to include on the report. You can also put one of the following codes in the first field (in this case, the information in the second field is irrelevant).
Codes:
Sequence Numbers
Sequence number and corresponding description you want to include on the bar graph.
Char
When setting up the sequence numbers, you are asked to fill in the Char field, which specifies what characters make up the bar for the category. For an Okidata printer running Microline emulation, we suggest you use one of the following codes: 143, 153, 170, 255. For an IBM printer, we suggest you use one of the following codes: 174, 175, 176, 177, 178, 219, 220, 222, 223.
When you press [Enter] after filling in this field, an example of the bar appears to the right of the Code field. Experimenting helps you decide the best choices for your business needs.
Code
Type C, U or D to indicate whether the bar is measured in counts, units or dollars.
Maximum Count Value
Fill in the maximum count you want to include on your Bar Graph. This defines the scale of the count bars. LubeSoft will not exceed this amount when printing the bar graph.
Maximum Dollar Value
Enter the maximum dollar value you want to include on your Bar Graph. This defines the scale of the dollar bars. LubeSoft will not exceed this amount when printing the bar graph.
Block Graphic Code
If you have an Okidata printer running Microline emulation, you must turn on the graphics to your printer. In the Block Graphic Code field, type the following numbers to turn on the graphics: 27, 33, 49. If you want to turn off the graphics, type the following numbers: 27, 33, 48.
Line Feed Code
You can control the spacing between your blocks with a line feed code. Leave this field blank to default to the standard line feeds.
If you have an Okidata printer running Microline emulation, type 27, 37, 53, n (where n is any number between 0 and 127). A reasonable range to use when experimenting with this option is 20 – 40. If you have an IBM printer, type 27, 74, n (where n is any number between 0 and 255). A reasonable range to use when experimenting is 30 – 60.