The Activity by Vehicle Report gives you an overall look at transactions and sales activity for a specific date or date range. The first page gives you general information, as well as information related to a specified vehicle make. The second page is a detailed breakdown of sales activity by make, grouped by manufacturer.
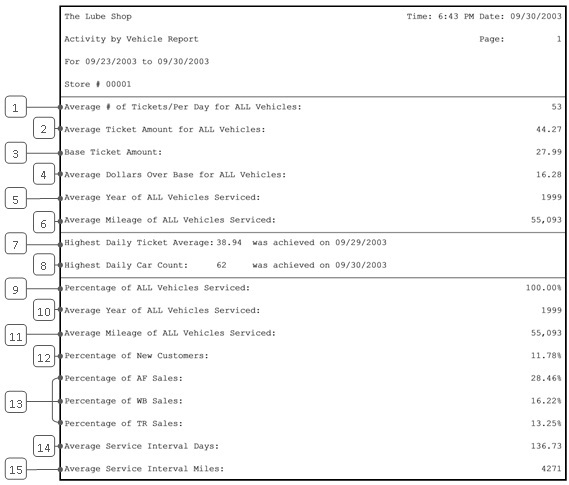
The top half of the first page analyzes the average amount for each ticket, as well as mileage and service interval information for all vehicles serviced. Results include the following figures:
The bottom half of the first page shows service information either for all vehicle makes and models or for the manufacturer or make you specified. It allows you to see the percentage of specific makes that were serviced as a part of the total number of vehicles serviced. You can also see the percentage of new customers, as well as the average number of service interval days and miles. Results include the following figures:
The second page is a breakdown of the sales activity for each manufacturer and shows information specific to each make within that manufacturer. For each manufacturer you will see the following information:
This page will also show a subtotal for all of the manufacturer information combined for each make.
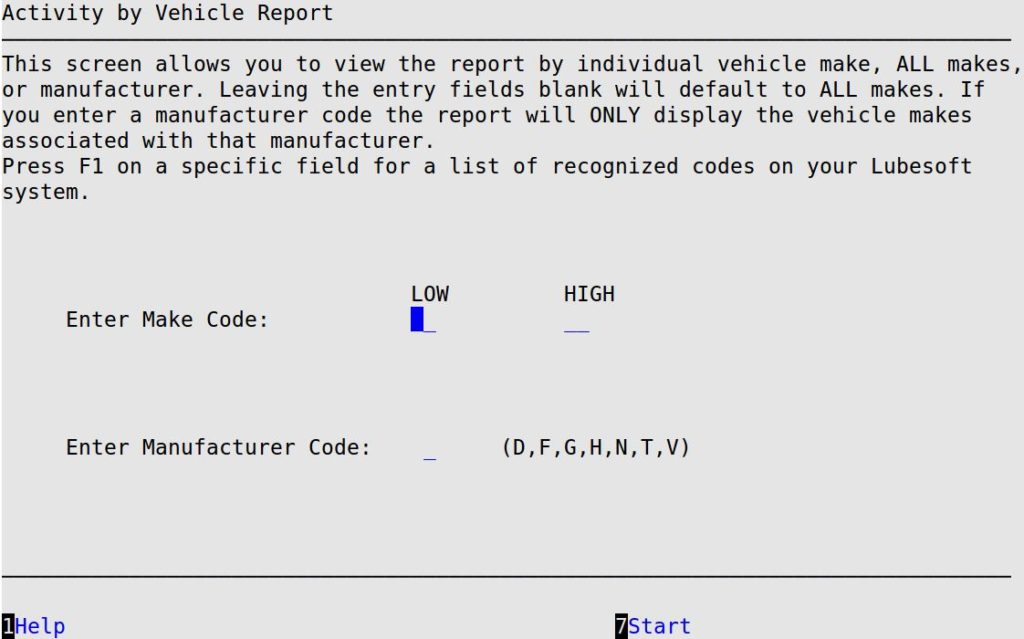
Use the following steps to print an Activity by Vehicle Report:
| Field | Description | ||
|---|---|---|---|
| Print Time on Report | Printing the time helps you identify the most current report when the same report is printed more than once during a day. This field defaults to Y to print the time on the report. If you do not want the time to print on a report, type N. We recommend that you always print the time on a report. | ||
| Duplex | This field appears for terminals that have report type 2 enabled in the Set Up Printer Controls screen. Duplex mode enables printing on both sides of the paper.
|
||
| Number of Printed Lines per Page | This value tells the computer how many lines to print on each page of the report. A typical 11-inch page can contain up to 66 lines, but this field defaults to 60 to allow three-line margins at the top and bottom of the page.
|
||
| Total Number of Lines per Page | This field indicates the length of the paper in the printer. A typical 11-inch page contains 66 lines. Your system interprets a 0 or 66 in this field to mean that standard 11-inch paper is loaded in the printer. Because a 66 causes a form feed to take more time, accepting the default, 0, is recommended. | ||
| Print Report To | This field tells the computer where to send the report. The following list contains the different selections available for this field.
|
||
| Command Line Options | The line at the bottom of the screen contains commands to print the report and to save or change the report settings.
|

| Note: | Press [F1] for a list of make codes. |
 |
If you choose to leave this field blank, this report can take a long time to generate. |
| Note: | Press [F1] for a list of manufacturer codes and the vehicle makes grouped in each one. |
Codes:
You can set up this report on the Set Up Closing Processes screen (1-6-3) to print automatically during closing processes.


| Callout | Item | Description | ||
|---|---|---|---|---|
| 1 | Average # of Tickets/Per Day for All Vehicles | Average number of tickets per day for a selected date or date range. Only dates that have at least one transaction will be used when calculating this number. | ||
| 2 | Average Ticket Amount for All Vehicles | Average sales amount per ticket for store tickets. This is based on gross sales. | ||
| 3 | Base Ticket Amount | The standard average ticket amount, as specified in the Base Ticket Amount field on screen 1 of the Center Control File (1-6-1-1). | ||
| 4 | Average Dollars Over Base for All Vehicles | Average dollar amount of items sold above the base ticket amount.
Average Dollars Over Base = Average Ticket − Base Amount |
||
| 5 | Average Year of All Vehicles Serviced | Average year of all vehicles serviced during the selected date or date range. | ||
| 6 | Average Mileage of All Vehicles Serviced | Average mileage of all vehicles serviced during the selected date or date range. | ||
| 7 | Highest Daily Ticket Average | Shows the highest daily ticket average (dollar amount) achieved as far back as you have run this report.
|
||
| 8 | Highest Daily Car Count | Shows the highest number of cars serviced as far back as you have run this report.
|
||
| 9 | Percentage of ALL Vehicles Serviced | Shows the percentage of vehicles serviced during the selected date range. Shows ALL, MANUFACTURER (for example, FORD) or SELECTED.
Vehicles Selected ÷ Total Vehicles ALL – Appears if you selected all vehicle makes to print on this report. This will show 100% if you selected ALL. MANUFACTURER – If you selected a specific vehicle manufacturer, this will show the name of that manufacturer (for example, FORD) and the percentage of vehicles serviced for that manufacturer code compared to all vehicles serviced within the specified date range. SELECTED – If you selected a range of vehicle makes, this will show SELECTED and the percentage of vehicles serviced within the make range compared to all vehicles serviced within the specified date range. |
||
| 10 | Average Year of ALL Vehicles Serviced | Shows the average year of vehicles serviced within the specified date range for either ALL vehicle makes, a MANUFACTURER of vehicle makes or a SELECTED vehicle make. | ||
| 11 | Average Mileage of ALL Vehicles Serviced | Shows the average mileage of vehicles serviced within the specified date range for either ALL vehicle makes, a MANUFACTURER of vehicle makes or a SELECTED vehicle make. | ||
| 12 | Percentage of New Customers | Percentage of total vehicles that were new customers for the selected date or date range. | ||
| 13 | Percentage of AF, WB, TR Sales | Percentage of total tickets that included sales of air filters, wiper blades or tire rotations.
|
||
| 13 | Percentage of AF, WB, TR Sales | Percentage of total tickets that included sales of air filters, wiper blades or tire rotations.
|
||
| 14 | Average Service Interval Days |
Average number of days between vehicle services for all vehicles for the selected date or date range. Only vehicles with more than one service will be used to calculate this number. | ||
| 15 | Average Service Interval Miles | Average number of miles customers have driven between services since their last service. This looks at all service histories for all vehicles within the selected date or date range. Only vehicles with more than one service will be used to calculate this number. | ||
| 16 | (Manufacturer) | Shows vehicles grouped by manufacturer. Depending on what you selected on the Report Control Screen, this will list a specific manufacturer or all manufacturers. | ||
| 17 | (Make) | Shows the vehicle makes for each manufacturer. | ||
| 18 | # Vehicles Serviced | Shows the number of times an individual make was serviced within the selected date or date range. | ||
| 19 | % of Total Vehicles | Shows the percentage of specific vehicle makes serviced, compared to the total number of vehicles serviced for the selected date or date range. | ||
| 20 | Vehicle Sales $ | Shows the total sales dollar amount for a specific vehicle make within the selected date or date range. | ||
| 21 | Subtotal | Subtotals the number of times all makes within a specific manufacturer were serviced within the selected date or date range. | ||
| 22 | Subtotal Veh % | Subtotals the percentage of all vehicle makes serviced within a specific manufacturer compared to the total number of vehicles serviced for the selected date or date range. | ||
| 23 | Subtotal Vehicle Sales | Shows the total sales dollar amount for all vehicle makes within a specific manufacturer within the selected date or date range. | ||
| 24 | Total Vehicles | Shows the total number of all vehicles serviced within the selected date or date range. | ||
| 25 | Total Veh % | Shows the percentage of all vehicles serviced during the date range. | ||
| 26 | Total Vehicle Sales | Shows the gross sales for all vehicles serviced during the selected date or date range. |
Use this report to view the average service interval information for vehicles for both miles and days. If you have target percentage sales goals, you can also use it as a quick check to see if you are meeting your air filter, wiper blades and tire rotation sales. This report can also be used to analyze your marketing efforts, by giving you demographic information about your customer base. For example, you can check service interval information to see if a recent marketing campaign was successful. You can also see the vehicle makes that are coming in most often and perhaps target a specific marketing campaign to those customers.
This report can also be used with the Inventory Usage Report and the Inventory Usage Status Report to help you decide which inventory items to keep in stock.