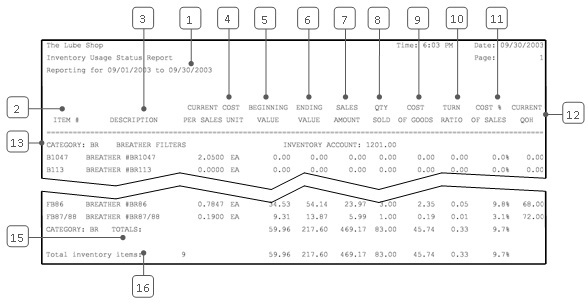
The detailed Inventory Usage Status Report gives usage history of inventory items. While it is quite similar to the Inventory Usage Report, this report includes items with zero sales during the time period. This is useful for evaluating your inventory practices. For example, it can help you determine how much of a particular item should be kept in stock. The report is organized by category and includes calculations based on transaction types 11 (sale), 12 (credit memo), and 15 (non-sale issue). Within a category, information on each item includes the following:
This information is summarized into totals for each category, which are also shown on the summary version of this report. The last line of the report prints overall calculations for all items included on the report.
The turn ratio is the rate of turnover of an item in stock, which relates to how long the item sits on your shelf. For example, a low turn ratio indicates a long shelf life. Because it is best not to tie up a lot of assets in inventory, the turn ratio helps you determine the best amount to keep on hand and how often to reorder. The cost-to-sales ratio gives the percentage of your revenue absorbed by the cost of the goods. This helps you determine whether your prices are appropriate.
Compared to the detailed Inventory Usage Report, the category totals and turn ratio are different because items with zero sales are included in the calculations on this report. Calculations for individual items should be the same on both reports.
Use the following steps to set up and submit an Inventory Usage Status Report:
| Field | Definition |
| Date | Enter the date or a range of dates to include in the report. Leave blank for all information currently on the system. This information is cleared regularly according to the Center Control File. |
| Category | Type a particular category if you want to limit the information on the report. Leave blank to print all categories. |
Report Contents

| Callout | Item | Description |
| 1 | Date Range | Range of dates for the report information. |
| 2 | Item # | Identification number of the inventory item. |
| 3 | Description | Item description. |
| 4 | Current Cost per Sales Unit | Cost per sales unit of the inventory item. The current cost is determined at each inventory update. This is the total of what you paid for all of the units of the item in stock, divided by the quantity on hand of the item. |
| 5 | Beginning Value | Value of the beginning quantity on hand. |
| 6 | Ending Value | Value of the ending quantity on hand. |
| 7 | Sales Amount | Revenue from retail sales of the item. |
| 8 | Qty Sold | Quantity sold. |
| 9 | Cost of Goods | Cost of the quantity sold. This is the total of the costs for each item sold, determined by the cost at which you received the items and the costing method you use (LIFO, FIFO, average or standard). |
| 10 | Turn Ratio | Average rate of inventory turnover during the time period. (This is also the cost of goods divided by the average value of your inventory.)
Turn Ratio = Cost of Goods ÷ Average Value of Inventory Average Value of Inventory = (Beginning Value + Ending Value) ÷ 2 |
| 11 | Cost % of Sales | Cost percent of sales. The cost of goods as a percentage of the sales price. (This is the ratio of the cost to the sales amount per unit.)
Cost % of Sales = (Cost of Goods ÷ Sales Amount) * 100 |
| 12 | Current QOH | Current quantity on hand of the item, as of the time the report is printed. (This is not necessarily the same as the end of the date range for the report.) |
| 13 | Category | Category of items reported, followed by the individual items in the category. |
| 14 | Inventory Account | Inventory account number set up for the category on the Set Up Category screen (1-7-5-3). |
| 15 | Category Totals | Totals for the category. The total turn ratio and total cost of sales are based on the total values in this column. |
| 16 | Total Inventory Items | Totals for the entire report. |
This report can be run on a weekly or monthly basis as an alternative to the detailed Inventory Usage Report. It is useful for identifying items with zero sales. You can also run it on a periodic basis to look for items that have no activity over a significant length of time. You may want to replace such items with inventory that will be more profitable.