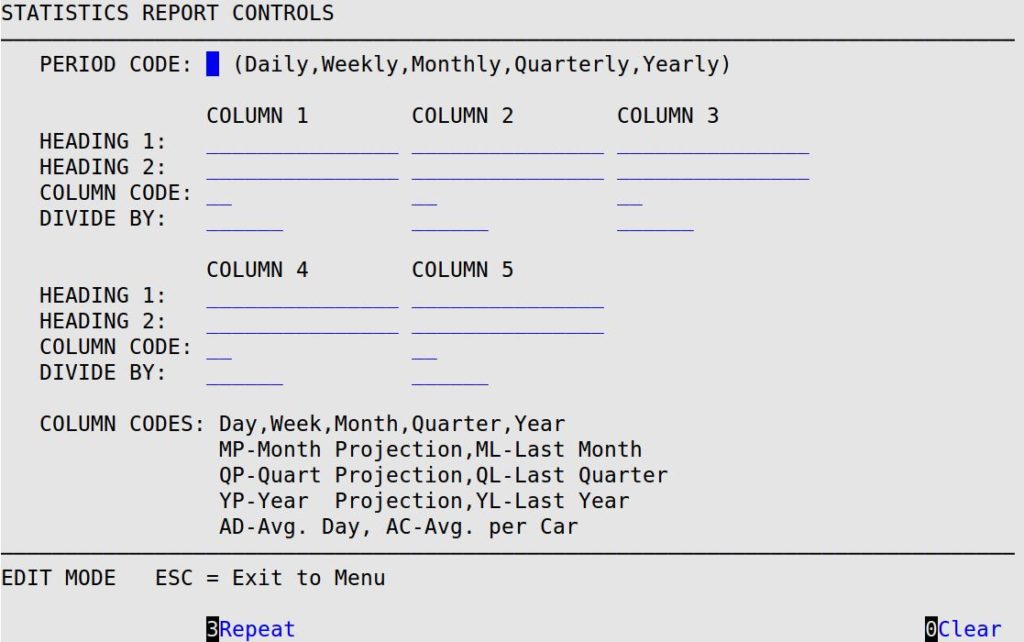
Use the following steps to set up column headings and define the content of each column for the Statistics Report:

Period Code
1-character code to indicate the time period of the Statistics Report format.
Codes:
Heading 1 and 2
15-character fields available for a descriptive column heading for up to five columns of the report.
Column Code
Type one of the following codes to indicate the information to be displayed in each column. Each code is listed below along with a description of how it is calculated. For each code, the count, percentage and dollars are shown. Make sure your calendar is set up correctly to ensure accurate reporting.
| Code | Description | Calculation |
| AC | Average per Car | Total dollars for the date range divided by the total number of tickets. The date range depends on the period code entered (D, W, etc.) |
| AD | Average per Day | Total number of tickets for the date range divided by the numbers of days open for the date range (from calendar). |
| D | Daily | Daily number of tickets and dollars. |
| M | Monthly | Monthly number of tickets and dollars. Uses last monthly closing date to the current date. |
| ML | Last Month* | Counts and dollars from the first day of the last month to the day of the last monthly closing. |
| MP | Monthly Projection* | Counts and dollars for the month based on the date range of one day after the last monthly closing to the current day. The counts and dollars are then divided by the number of days the store was open for the month to date and multiplied by the total number of days the store is open for the month (based on calendar setups). |
| Q | Quarterly | Quarterly number of tickets and dollars. Uses last quarterly closing date to the current date. |
| QL | Last Quarter* | Counts and dollars from the first day of the last quarter to the day of the last quarterly closing. |
| QP | Quarterly Projection* | Counts and dollars for the quarter based on the date range of one day after the last quarterly closing to the current day. The counts and dollars are then divided by the number of days the store was open for the quarter to date and multiplied by the total number of days the store is open for the quarter (based on calendar setup). |
| W | Weekly | Weekly number of tickets and dollars. Uses last weekly closing date to the current date. |
| Y | Yearly | Yearly number of tickets and dollars. Uses last yearly closing date to the current date. |
| YL | Last Year* | Counts and dollars from the first day of the last year to the day of the last yearly closing. |
| YP | Yearly Projection | Counts and dollars for the year based on the date range of one day after the last yearly closing to the current day. The counts and dollars are then divided by the number of days the store was open for the year to date and multiplied by the total number of days the store is open for the year (based on calendar setups). |
* For accurate projections and numbers, you must have your monthly, quarterly, and yearly closings on the last working day of each calendar month.
Divide By
Specify the dividing number for each report column to fit larger numbers on the report.
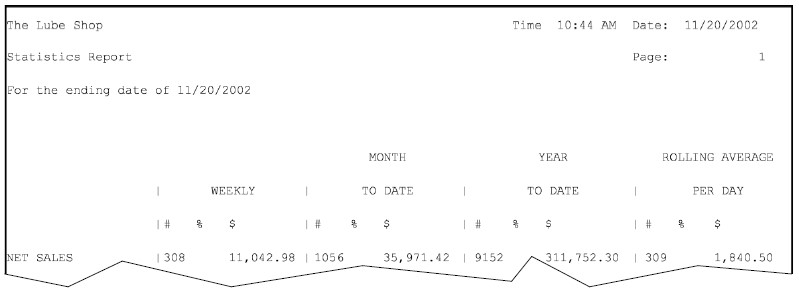
For Example…
The screen setup at the beginning of this section causes the Statistics Report headings to have the following look and feel:
